New Analytics Dashboard for Software License Management
Today, we are happy to share a new version of the analytics dashboard (available to all customers), which includes many new cool features. We will sum this up in this post. The new analytics dashboard will be improved continuously, with the aim to offer more in-depth analysis of the data.
If you have any feedback, we would be happy to hear from you!
Getting Started
- Login on your account: https://app.cryptolens.io/Account/Login
- Go to https://app.cryptolens.io/Stats
- Click on the link on the top of the page to visit the new page.
Note: After a while, the new page (https://analytics.cryptolens.io/index.html) will redirect you back to the old page. To view it again, you just need to click on the link again. We will fix this in the coming weeks.
Feature Walkthrough
World Map and Filters (by country)
To start with, you will see all the data that has accumulated since the beginning (“all time” option). You can control this easily with the 5 buttons available in the top menu (we will discuss how to set a custom time period a bit later).

The map allows you to examine stats from specific regions. You can select the desired countries and then click on “show/hide filters” and click on the “filter” button close to the country tags, as shown below (filtering on Sweden and Norway). Once we have activated the filter, it will turn blue. You can then click on the filter again and it will turn white, meaning it’s no longer active.

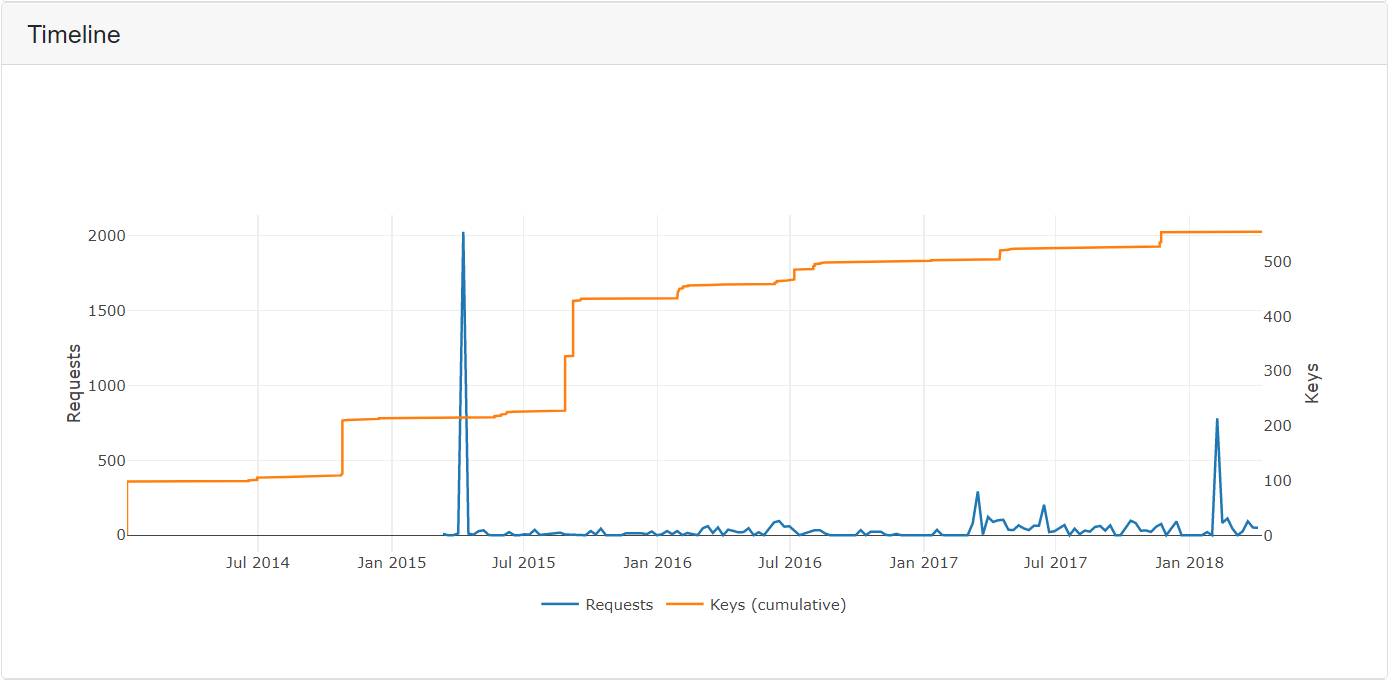
Timeline
If you are interested in a different time region than those supported on the top menu, you can use the timeline to select an area of interest. To reset the timeline, just double-tap on it.
Time of Day
One way to understand how your application is being used is by examining when it’s used during the day. This was already available in the old analytics dashboard. The key difference in the new one is that it takes into account the local time zone of the end user.

Most Active Customers and Other Metrics
The last part includes a short summary of the key metrics such as how many licenses were created and how many requests were made during a specific time period. Moreover, it’s now also possible to compare “how active” license keys and customers are relative to each other. For instance, in the customer list, you can see your top most active and inactive customers, which can help you to discover the early adopters in a technology adoption lifecycle model.
